ManicTime Server v2.1
What's new in this version:
Server statistics
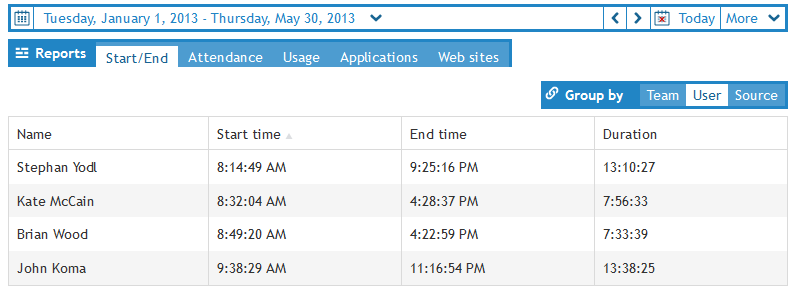
Server now processes the data and generates some statistics. You can view the statistics if you visit the server with a browser. Website works on all current browsers (for IE use IE9 or later). By default each user can see only his/her own data, admins can see all the data.Start/End times for each user
Shows start and end times for the day for specified users. If the date range is set to more than one day, then start time is an average of all start times on selected days (same for end times).
|
| Start/End times |
Attendance
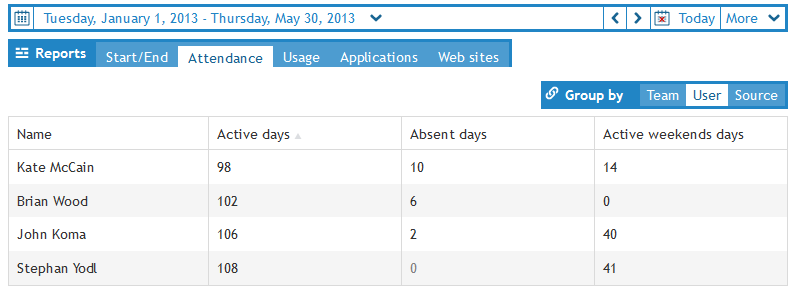
View is mostly useful when date range is set to longer periods (month, year...).- Active days - Days when computer usage was recorded
- Absent days - Days when computer usage was not recorded
- Active weekends days - Weekend days when computer usage was recorded
|
| Attendance |
Usage
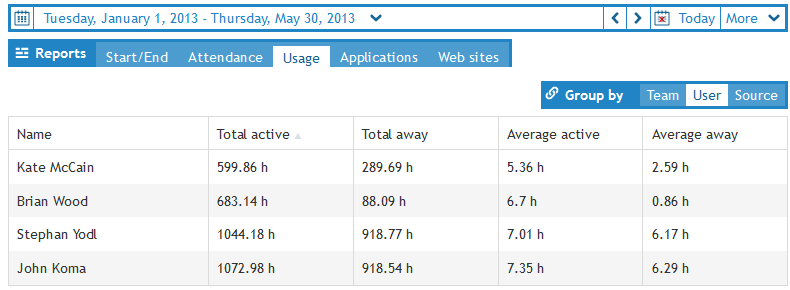
Shows total for Active and Away time for the selected date range. Average Active and Average Away are calculated with:Average Active = Total usage / No. of days there was some usage
It will not count the days on which there was no usage.
|
| Usage |
Top Applications
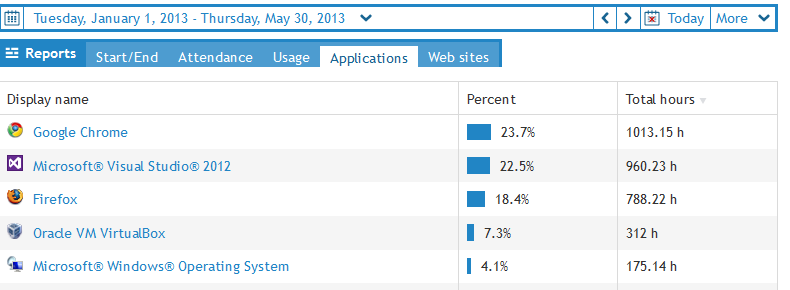
Top applications for the selected date range (top web sites works in a similar way)
|
| Top applications |
Application or web site details
You can get more information about the application or web site by clicking it in the Top Applications or Top web sites view.Details show three charts.
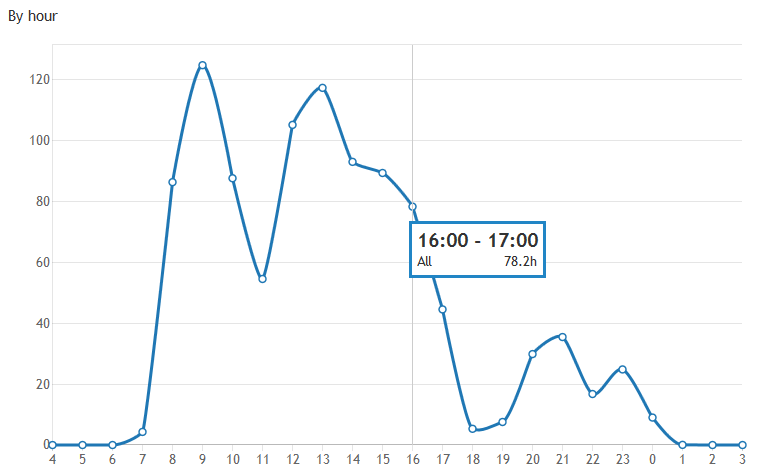
By hour chart
Sum of all usage on specific hour for the selected date range.
|
| By hour chart |
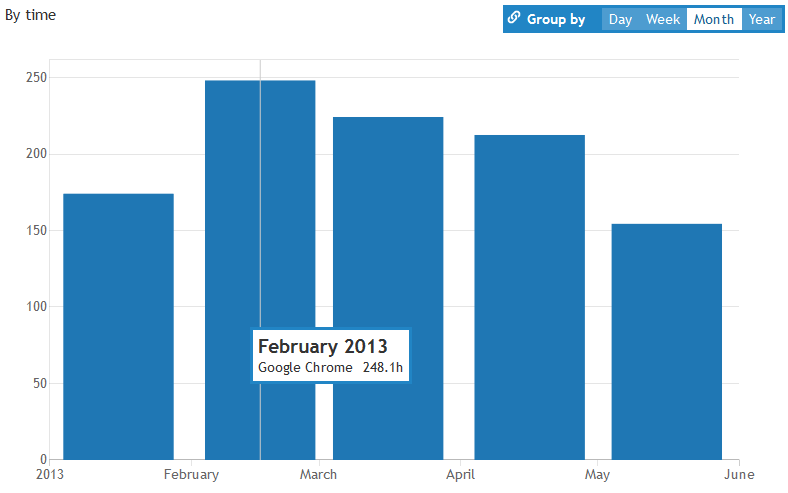
By time chart
You can change the view for day, week, month or year.
|
| By time chart |
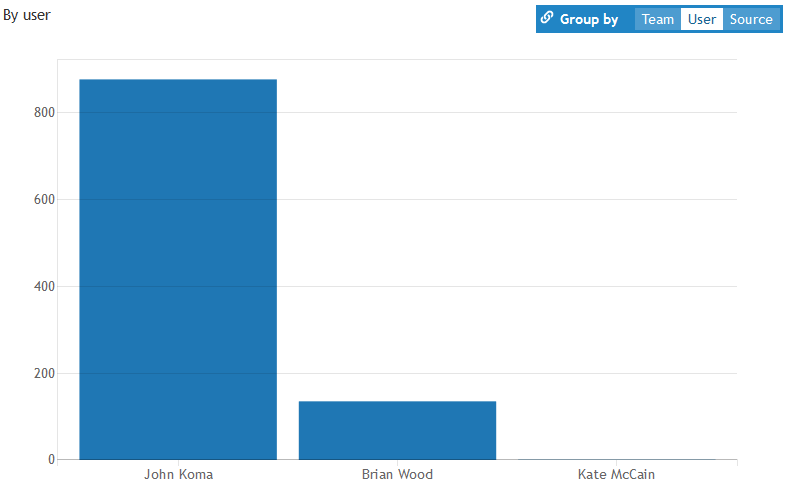
By user chart
You can change the view for users, teams or sources (computers).
|
| By user chart |
Server admin settings
To open admin settings click on the gear icon in the upper right corner.

|
| Server admin console |
Timelines
This is the only tab in the admin section which will show up for users as well.For users:
Users will only see their own timelines. They can rename the timelines, but not delete them.
For admins:
Administrators will see all the timelines, they can rename or delete them.
General
- Day start shift - Day start shift allows you to tell ManicTime from when to when the day is counted. Similar to the feature in the client, a setting of 4 will make statistics count days from 4am to 4am
- Week start - Set first day of week
- Send error reports - Send error reports to our server
Tags
Define server tags, which can then be used in the client. Before v2 you could use full tags to specify tag combinations, which are then used by clients. For example:
Client 1, Project X, Activity 1
Client 2, Project Y, Activity 2
Tag, For all
[doman\user2, domain\user1]
Tag, Some users
{team1, team2}
Tag, Some teams
Project X,
Project Y,
,Design
,Programming
,Testing
Project X, Design
Project X, Programming
Project X, Testing
Project Y, Design
Project Y, Programming
Project Y, Testing
Teams
Generate groups of users. Teams are useful in statistics, they allow you to view combined statistics for selected users.Roles
Currently only Administrator role is available. Use it to add other users to Administrator role.Users
List of users who connected to this server.Setup
Generates .xml file which you can use to deploy ManicTime in a corporate environment.By default, server is running on port 8080. By default, url of the web server running on local machine is: http://localhost:8080.